In February 2024, HM Treasury asked the National Infrastructure Commission (NIC) to undertake a study on the challenges to making the electricity distribution networks in Great Britain fit for net zero. To support the study, the NIC commissioned Regen and EA Technology Ltd to conduct an electricity distribution network capacity analysis. In this insight piece, we dive under the hood of the analysis and pull out the key takeaways.
Key takeaways
The level of investment required to make the electricity distribution networks fit for net zero is found to be significant, but lower than previous forecasts
The majority of investment needed is on the low voltage network
Load-related expenditure is scaled to handle a winter stress test event, which modelled a peak demand of 153 GW in 2050
A combination of traditional reinforcement and smart flexibility solutions is needed to meet net zero at lowest cost
Local case studies show that physical reinforcement is the first step in achieving decarbonisation ambitions
The NIC is carrying out a study to provide government with recommendations on the policy, regulatory and governance changes needed to make the distribution network in Great Britain fit for net zero. The distribution network delivers power to homes and businesses across the country across over almost a million kilometres of power lines and around 600,000 substations. It connects to the electricity transmission network which transports power over longer distances. The requirements of the distribution network are set to materially change as electricity increasingly provides more of our energy for heating and transport including the uptake of millions of heat pumps and electric vehicles, rooftop solar and other low carbon technologies.
In partnership with EA Technology Ltd, Regen provided the NIC with research, analysis and modelling to support their study. This included analysis of future network capacity requirements to achieve a net zero scenario, with a number of sensitivities, which can be used assess the scale of investment required in a range of network and non-network solutions.
The outputs of Regen and EA Technology's analysis are intended to give the NIC an evidence base to consider the potential scale of network load-related expenditure (LRE) across all GB distribution networks and the challenges this will present at both a network and a local level. The model shows how future network loads might change between now and 2050 in a net zero decarbonisation scenario, the extra network capacity that might be needed to meet these additional loads and how alternative flexible and non-network asset solutions might be used to manage and reduce costs. The National GB Network analysis was conducted over 14 model runs with variations in assumptions about the mix of heat technology, flexibility, heat demand and other sensitivities.
Level of required investment is lower than previous forecasts
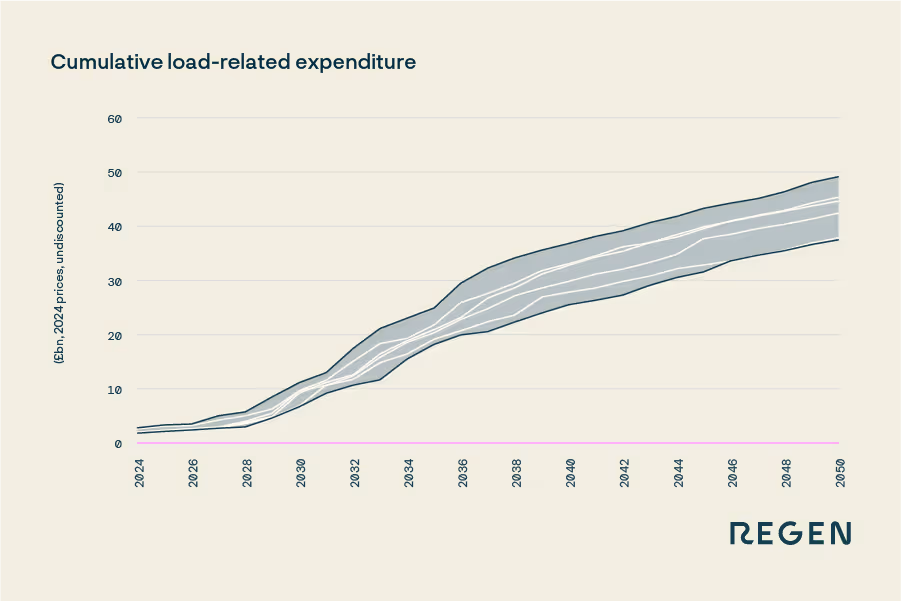
The main model runs produced an expenditure range of £37bn to £49bn, depending on the heating mix and assumed flexibility levels. The expenditure profile varied with each model run, however, the average annual expenditure ranged between £1.4bn and £1.8bn. This would be a significant increase when compared with recent price control reinforcement and LRE. The RIIO-ED1 price control period delivered an average of £274 million per annum in distribution network reinforcement (from 2015-22). The average load-related budget for the five-year RIIO-ED2 price control period (2024-28) is £640m.
However, this range is lower than the range modelled in previous distribution network investment studies. For example, the joint DESNZ/Ofgem Electricity Networks Strategic Framework modelling suggested an expenditure range that equated to £2.3 bn to £3 bn per year on average. The DESNZ modelling included 132 kV network assets which this analysis did not.
Figure 1 Range of cumulative distribution network load-related expenditure in main model runs Note: excludes 132 kV network and LV service cables
The majority of investment is on the low voltage network
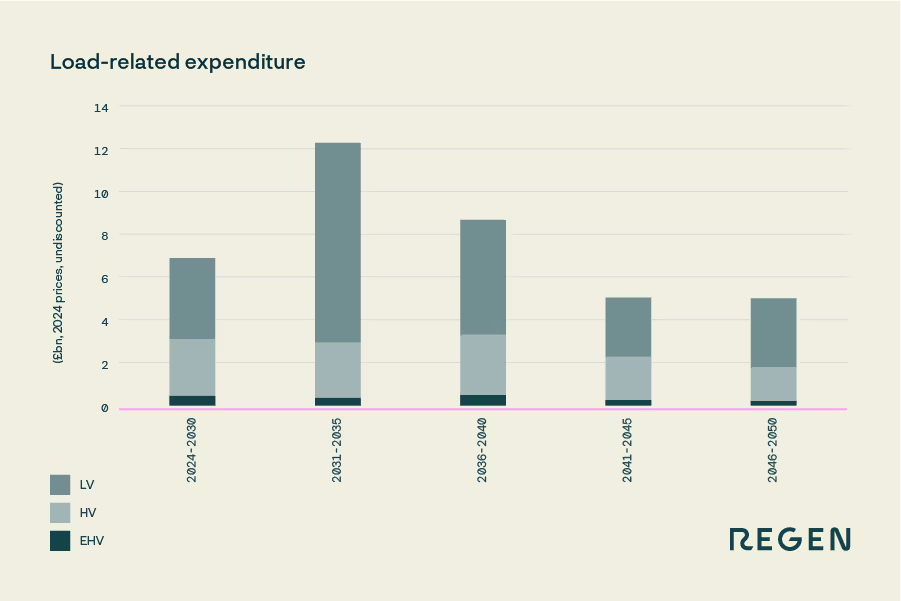
The majority of load-related expenditure will be in the low voltage (LV) network. In the main model runs, 62% and 68% of expenditure will be to solve constraints on the LV network. The LV network provides power to homes and businesses at 230 V and is the most expansive voltage tier, making up 45% of cable length and 96% of substations onthe distribution network.
This is as expected, as the key drivers of network load are the forecasted growth of EVs and heat pumps and the electrification of residual domestic and commercial heat. By 2050 in model run 1, which has higher heat pump adoption and levels of flexibility, during peak system demand at 9.00-9.30am, 45 GW comes from heat and 22 GW comes from road transport.
Note that the model scope did not include the 132 kV network and industrial and commercial demand was highly simplified.
Figure 2 Load-related expenditure for run 1 (higher heat pump adoption and higher levels of flexibility) broken down by voltage tier
The winter stress test sensitivity significantly increases peak load and overall expenditure
The model's winter peak stress test sensitivity led to an increase in cumulative network load-related expenditure to £76 bn (2024 to 2050), and an increase in the peak distribution network demand to 153 GW in 2050. In this model run, loads from heat pumps and electric heating technologies were increased significantly and lower levels of flexibility from EV charging, heat and storage were assumed. The heating loads and flexibility assumptions are not based on a defined resilience standard but were deliberately conservative. Arguably, in a real winter stress event, we would expect to see a fall in demand in some sectors; the results do, however, underscore the importance of future network resilience standards and how they are modelled in the context of providing critical energy for heat and transport.
Higher levels of implicit flexibility reduce expenditure
All model runs included some level of both implicit and explicit flexibility. Implicit flexibility, where consumers and flexibility providers (including batteries) are assumed to respond to price signals, is built into the load profiles and has the effect of reducing peak loads on the network. The effect of increased levels of implicit flexibility with higher heat pump uptake is a reduction in cumulative load-related expenditure by £7bn from £45bn to £38bn. As well as reducing the level of expenditure, the greater use of flexibility also has the impact of delaying the need for expenditure (providing further benefit on a discounted basis). In model run 4, with lower levels of flexibility, heat contributes 40 GW and road transport contributes 28 GW to peak demand in 2050.
Explicit flexibility, whereby DNOs can call upon flexibility providers to increase or reduce loads for a fee, was included as one of the available model solutions. Explicit flexibility was expected to provide a cost-optimal solution to manage marginal constraints where the frequency and severity of a constraint is low. However, in the model runs this solution was utilised less often than may have been expected.
Insights from the local case studies
The local case study analysis provides a closer-to-real-life illustration of the options and choices that network planners will face when examining specific network locations. The seven archetype case studies are illustrative only and the results cannot be extrapolated to the GB level. However, they do demonstrate the importance of geography and local demographics, as well as the exact configuration of the legacy network, in determining the distribution of load growth and the optimal intervention strategy.
Several key themes emerged from the case studies:
Increased scale of network reinforcement: Physical interventions were unavoidable in all but one of the case studies modelled. LV networks have historically been designed for relatively low loads per customer (the case study networks ranged from 1 to 5 kVA per customer) with energy for heat and transport provided by fossil fuels. Although these results are illustrative, they do support the overall national analysis that the scale and pace of LV network reinforcement needed is far larger than the present level of reinforcement works.
Flexibility can enable reinforcement delay or avoidance: Targeted, local Demand Side Response could enable DSOs to manage capacity constraints on the LV networks. This could provide them more time to assess future network reinforcement options or, in select cases, avoid reinforcement over a longer period.
The location of new demand determines when intervention is required: In some case studies the years of intervention varied widely, along with whether flexibility would be a suitable intervention. The case studies highlight that geographical distribution of customer loads of LV feeder cables can drive the need for physical network reconfiguration, even if the upstream secondary substation capacity is not exceeded.
Network suitability for the future: The existing network topology is a major factor for the ability of an LV network to be able to supply the large volume of new loads.
Projected constraints varied by network archetype: The types of properties an LV network feeds, and their ability to accommodate new LCTs, is a key factor in the likelihood they will require interventions.
A key learning from the case studies is that, whereas the upgrade of the transmission network is concerned with the delivery of a smaller number of very large upgrades, the upgrade of the low voltage networks is concerned with the delivery of hundreds of thousands of individual interventions and investments. This requires a different approach and emphasises the importance of; data quality, monitoring, forecasting, decision support tools, the ability to use smart solutions, resource planning and the skills and expertise of network planners. It also requires a high level of coordination and delivery planning between network operators and a range of stakeholders, including local authorities, customers and businesses, and supply chain partners.